param_boxplot
Function param_boxplot can help you visualize the distribution of selected parameter(s). By default, this plot uses all configuration values on the selected parameter(s) and map all value aspects to different slices.
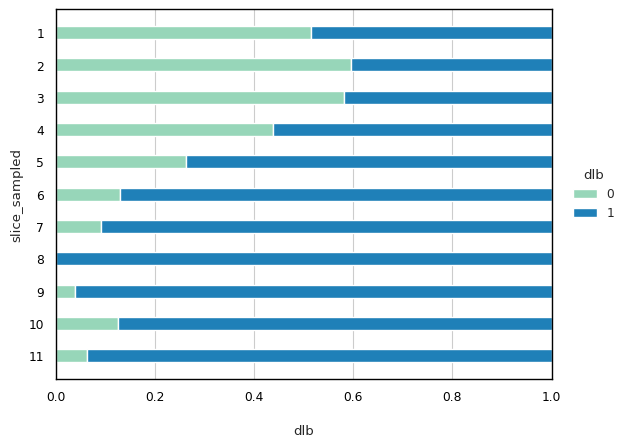
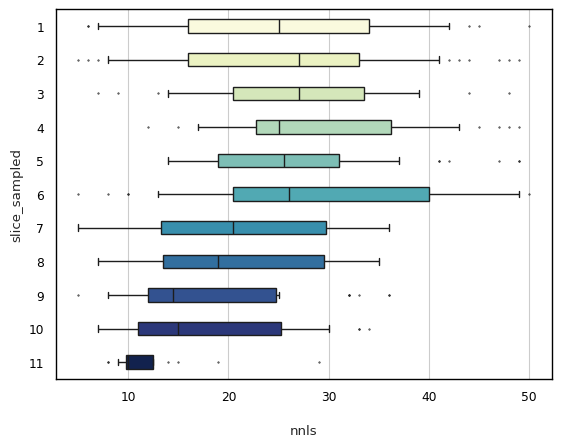
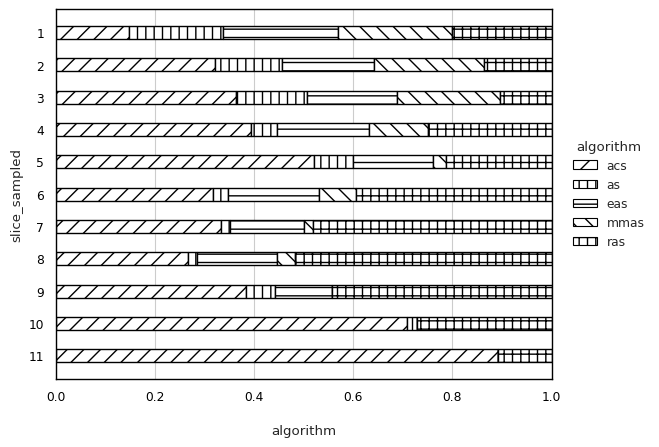
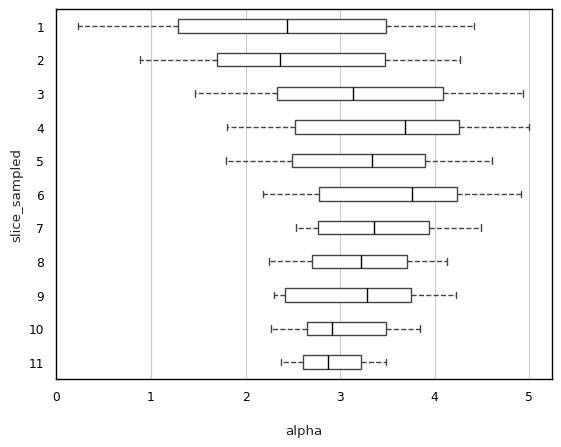
For categorical and continuous parameters, this function produces different visualizations: a normalized stacked bar chart for categorical parameters and a boxplot for continuous parameters, respectively.
In order to draw more flexible plots, you can provide parameters configs, parameters, y, shownan, showfliers, showmeans, palette and monochrome.
To check more details for its available arguments, call:
import craceplot as cplot

help(cplot.param_boxplot)
Help on function param_boxplot in module craceplot.plots.parameters:

param_boxplot(data: 'CraceResults' = None, options: 'CplotOptions' = None, configs: "Union[Literal['all', 'final', 'elites'], list[int], None]" = 'all', parameters: 'Union[list[str], str, None]' = None, _console: 'bool' = True, shownan: 'bool' = True, nbins: 'int' = 5, showfliers: 'bool' = False, showmeans: 'bool' = False, dpi: 'int' = 800, y: 'str' = 'slice_sampled', palette: 'str' = 'vlag', fliersize: 'float' = 0.5, monochrome: 'bool' = True)
    Entrance to call boxplot in python console

    :param data: object CraceResults that must be provided.
    :param options: object CplotOptions that must be provided.
    :param configs: Optional. Selected configurations for plotting, higher priority than option numConfigurations/selConfigurations.
                    | Union[Literal['all', 'final', 'elites'], list[int], None]
    :param parameters: A list of parameter names selected for plotting, higher priority than option multiParameters.
    :param y: A string of parameter name used to map value aspects.
              | str='slice_sampled'
    :param shownan: A boolean value used to plot including/excluding missing values.
    :param showfliers: A boolean value used to plot including/excluding outliers.
    :param showmeans: A boolean value used to plot including/excluding mean values.
    :param palette: A string of palatte name for plotting.
    :param monochrome: A boolean value used to enable/disable coloring the plot.
Take ACOTSP for example:
import os
from pathlib import Path

cplot_home = cplot.where()

p = Path(os.path.join(cplot_home, 'inst', 'examples', 'acotsp'))
path_to_acotsp = os.path.relpath(p, Path.cwd())

results, options = cplot.run('-l', path_to_acotsp)
/opt/hostedtoolcache/Python/3.10.22/x64/lib/python3.10/site-packages/craceplot
#---------------------------------------------------------------------------------------------------
# Reading crace plot options...
# Arguments: ['-l', '../../../../../../../../opt/hostedtoolcache/Python/3.10.22/x64/lib/python3.10/site-packages/craceplot/inst/examples/acotsp']
#
# Loading crace plot options...
You can plot with the param_boxplot method:
cplot.param_boxplot(data=results, options=options, parameters=['algorithm', 'alpha'])
You can also call this function with personalized arguments:
import random
max = results.configurations.n_config
cplot.param_boxplot(data=results, options=options, parameters=['dlb', 'nnls'],
                    configs=random.sample(range(1, max), int(0.5*max)), # random selected a half of configuratioons
                    monochrome=False, shownan=False, palette='YlGnBu',
                    showfliers=True)