param_pairplot
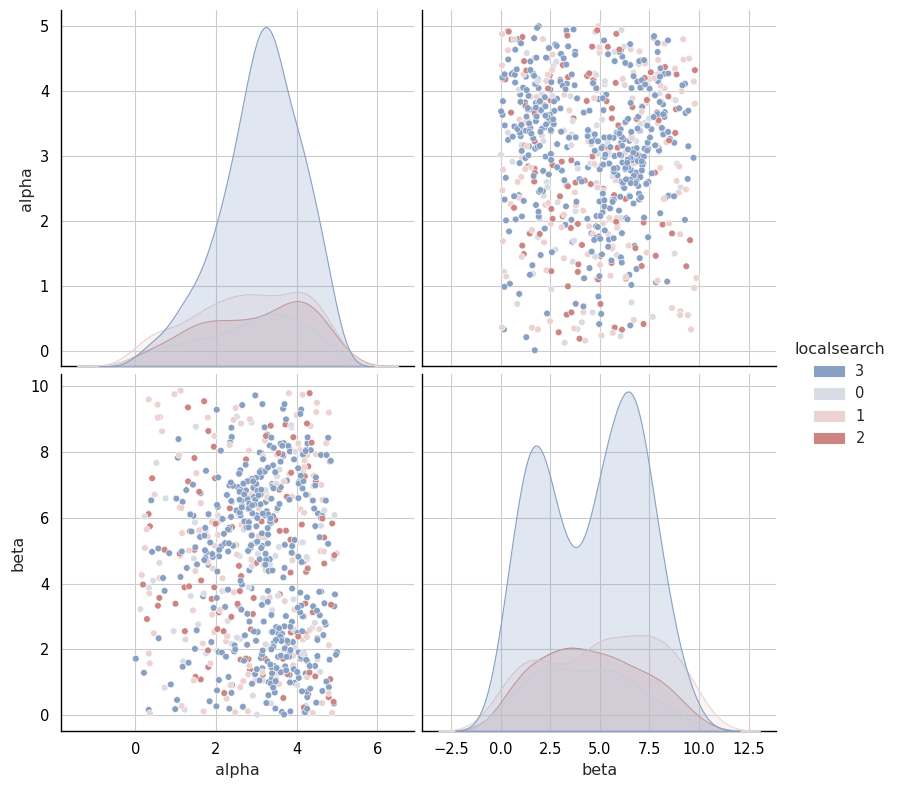
Apart from the heatmap and joint plot, pair plot is also provided to display the pairwise relationships of provided parameters and the distribution of each parameter on the hue parameter. Similar to param_jointplot, by default, this plot uses all configuration values on the selected two categorical parameters, you can also use argument configs to focus on the selected configurations.
To draw more flexible pair plots you can call this function via providing arguments configs, parameters, hue, shownan, palette and kind.
The argument hue is the parameter provided to map plot aspects to different colors for the provided at least two parameters.
The argument kind is the type of plot for the diagonal subplots and its avaliable values are in [‘auto’, ‘hist’, ‘kde’, None]. If ‘auto’, choose based on whether or not hue is used.
The argument shownan enables or disables the inclusion of NaN values for the selected parameters.
In the case of mutually exclusive parameters, setting shownan=False results in empty intersections.
To check more details for its available arguments, call:
import craceplot as cplot

help(cplot.param_pairplot)
Help on function param_pairplot in module craceplot.plots.parameters:

param_pairplot(data: 'CraceResults' = None, options: 'CplotOptions' = None, configs: "Union[Literal['all', 'final', 'elites'], list[int], None]" = 'all', parameters: 'Union[list[str], str, None]' = None, slice: 'bool' = True, _console: 'bool' = True, shownan: 'bool' = True, dpi: 'int' = 800, hue: 'str' = None, palette: 'str' = 'vlag', kind: "Literal['auto', 'hist', 'kde', None]" = 'kde', height: 'int' = 4)
    Entrance to call pairplot in python console

    :param data: object CraceResults that must be provided.
    :param options: object CplotOptions that must be provided.
    :param configs: Optional. Selected configurations for plotting, higher priority than option numConfigurations/selConfigurations.
                    | Union[Literal['all', 'final', 'elites'], list[int], None]='all'
    :param parameters: A list of parameter names selected for plotting, higher priority than option multiParameters.
    :param hue: A string of parameter name selected for plotting.
    :param shownan: Boolean used to plot including/excluding missing values.
    :param palette: A string of palatte name for plotting.
    :param kind: A string from provided values for the type/shape of plots.
Take ACOTSP for example:
import os
from pathlib import Path

cplot_home = cplot.where()

p = Path(os.path.join(cplot_home, 'inst', 'examples', 'acotsp'))
path_to_acotsp = os.path.relpath(p, Path.cwd())

results, options = cplot.run('-l', path_to_acotsp)
/opt/hostedtoolcache/Python/3.10.22/x64/lib/python3.10/site-packages/craceplot
#---------------------------------------------------------------------------------------------------
# Reading crace plot options...
# Arguments: ['-l', '../../../../../../../../opt/hostedtoolcache/Python/3.10.22/x64/lib/python3.10/site-packages/craceplot/inst/examples/acotsp']
#
# Loading crace plot options...
You must provide at least two continuous parameters using the parameters argument, and you can plot the pair plot by using code param_pairplot:
cplot.param_pairplot(data=results, options=options, parameters=['alpha', 'beta'], hue='localsearch')
cplot.param_pairplot(data=results, options=options,
                     parameters=['q0', 'rasrank', 'elitistants'],
                     hue='algorithm',
                     kind='auto',
                     shownan=False,
                     height=3)
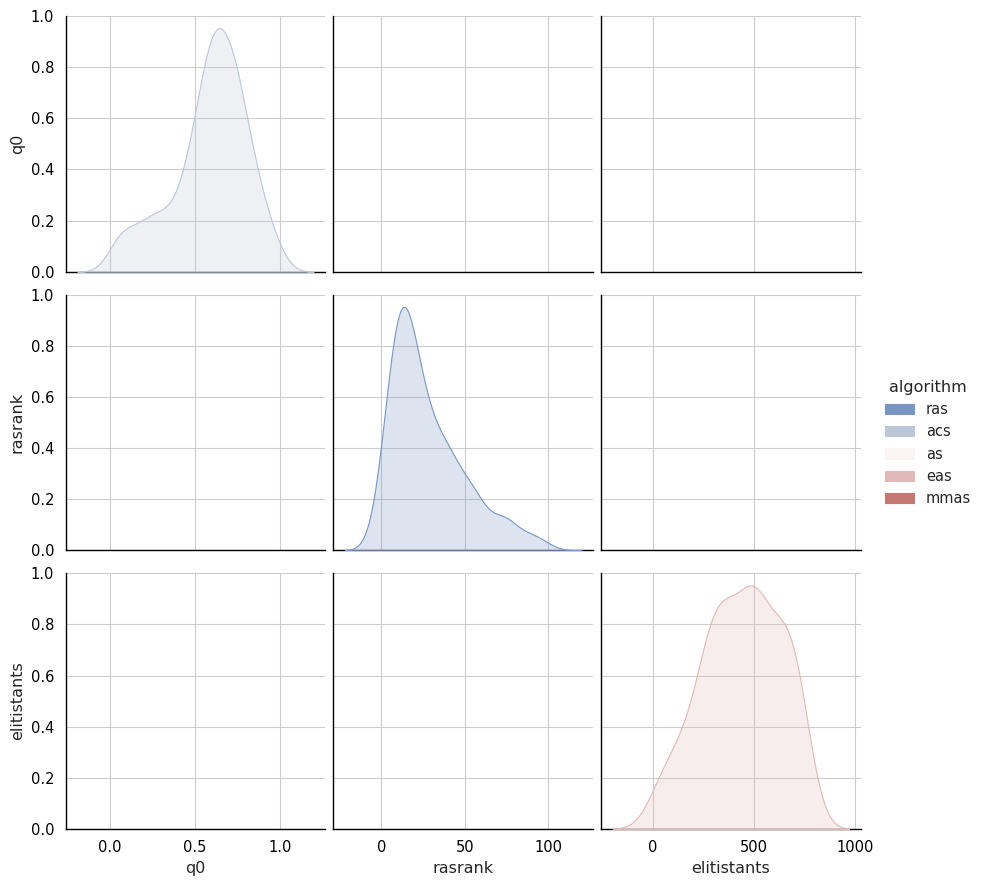
As shown in the above plot, when there is no joint sub-plots, it means all selected parameters are mutually exclusive.