qual_boxplot
Function qual_boxplot can help you visualize the performance of selected configuration(s).
You must provide data in CraceResults format, the source of data (training or testing) you select for plotting, and the number of configurations you wish to use.
Addtionally, you need to provide some plot arguments as well. To check more details for its available arguments, call:
import craceplot as cplot

help(cplot.qual_boxplot)
Help on function qual_boxplot in module craceplot.plots.quality:

qual_boxplot(data: 'CraceResults' = None, options: 'CplotOptions' = None, select: 'list' = None, slice: "Union[Literal['budget', 'b', 'B', 'e', 'E', 'experiment', 'time', 't', 'T'], bool, None]" = None, out_dir: 'str' = None, file_name: 'str' = None, title: 'str' = None, num: "Literal['all', 'final', 'elites', None]" = None, source: "Literal['training', 'test', 'testing', None]" = None, _console: 'bool' = True, showfliers: 'bool' = False, showmeans: 'bool' = False, stest: 'bool' = False, dpi: 'int' = 800, x: 'str' = 'configuration_id', y: 'str' = 'quality', hue: 'str' = 'configuration_id', palette: 'str' = 'vlag', fontsize: 'int' = 12, fliersize: 'float' = 0.5, show_ori: 'bool' = False, errorbar: "Literal['ci', 'rpd']" = 'rpd', check_elites: 'bool' = False)
    Entrance to generate boxplots for quality comparison.

    :param data: Object 'CraceResults' containing the quality results to be plotted.
    :param options: Object 'CplotOptions' containing the plotting options.
    :param select: Optional. A list of experiment, scenario, or method identifiers selected for plotting.
    :param slice: Optional. Selects how the results are sliced before plotting. Supported values are 'budget' ('b', 'B'), 'experiment' ('e', 'E'), and 'time' ('t', 'T'). A boolean can also be used to enable or disable slicing.
    :param out_dir: Output directory for the generated figure.
    :param file_name: File name of the generated figure.
    :param title: Optional title of the figure.
    :param num: Selects the configurations to include in the plot: 'all', 'final', or 'elites'.
    :param source: Selects the source of the results, either 'training' or 'test'/'testing'.
    :param showfliers: Whether to display outliers in the boxplots.
    :param showmeans: Whether to display the mean value.
    :param stest: Whether to perform statistical tests between the compared groups.
    :param dpi: Resolution of the output figure in dots per inch.
    :param palette: Name of the color palette used for the boxplots.
    :param fontsize: Font size used in the figure.
    :param fliersize: Marker size used for outliers.
    :param show_ori: Whether to show the original/default configuration.
    :param errorbar: Type of error bar to display. Supported values are 'ci' for confidence interval and 'rpd' for relative percentage deviation.
    :param check_elites: Whether to check and use elite configurations when generating the plot.
Take ACOTSP for example:
import os
from pathlib import Path

cplot_home = cplot.where()

p = Path(os.path.join(cplot_home, 'inst', 'examples', 'acotsp'))
path_to_acotsp = os.path.relpath(p, Path.cwd())

results, options = cplot.run('-l', path_to_acotsp)
/opt/hostedtoolcache/Python/3.10.22/x64/lib/python3.10/site-packages/craceplot
#---------------------------------------------------------------------------------------------------
# Reading crace plot options...
# Arguments: ['-l', '../../../../../../../../opt/hostedtoolcache/Python/3.10.22/x64/lib/python3.10/site-packages/craceplot/inst/examples/acotsp']
#
# Loading crace plot options...
You can plot with the qual_boxplot method:
cplot.qual_boxplot(data=results, options=options, source='training', num='all')
#
# Adjusted p-values of the last two elite configurations:
        495     588
495  1.0000  0.3503
588  0.3503  1.0000
588 vs. 495: Wilcoxon test (paired samples) with Benjamini-Hochberg correction, P_val:3.503e-01 Stat=6.100e+02
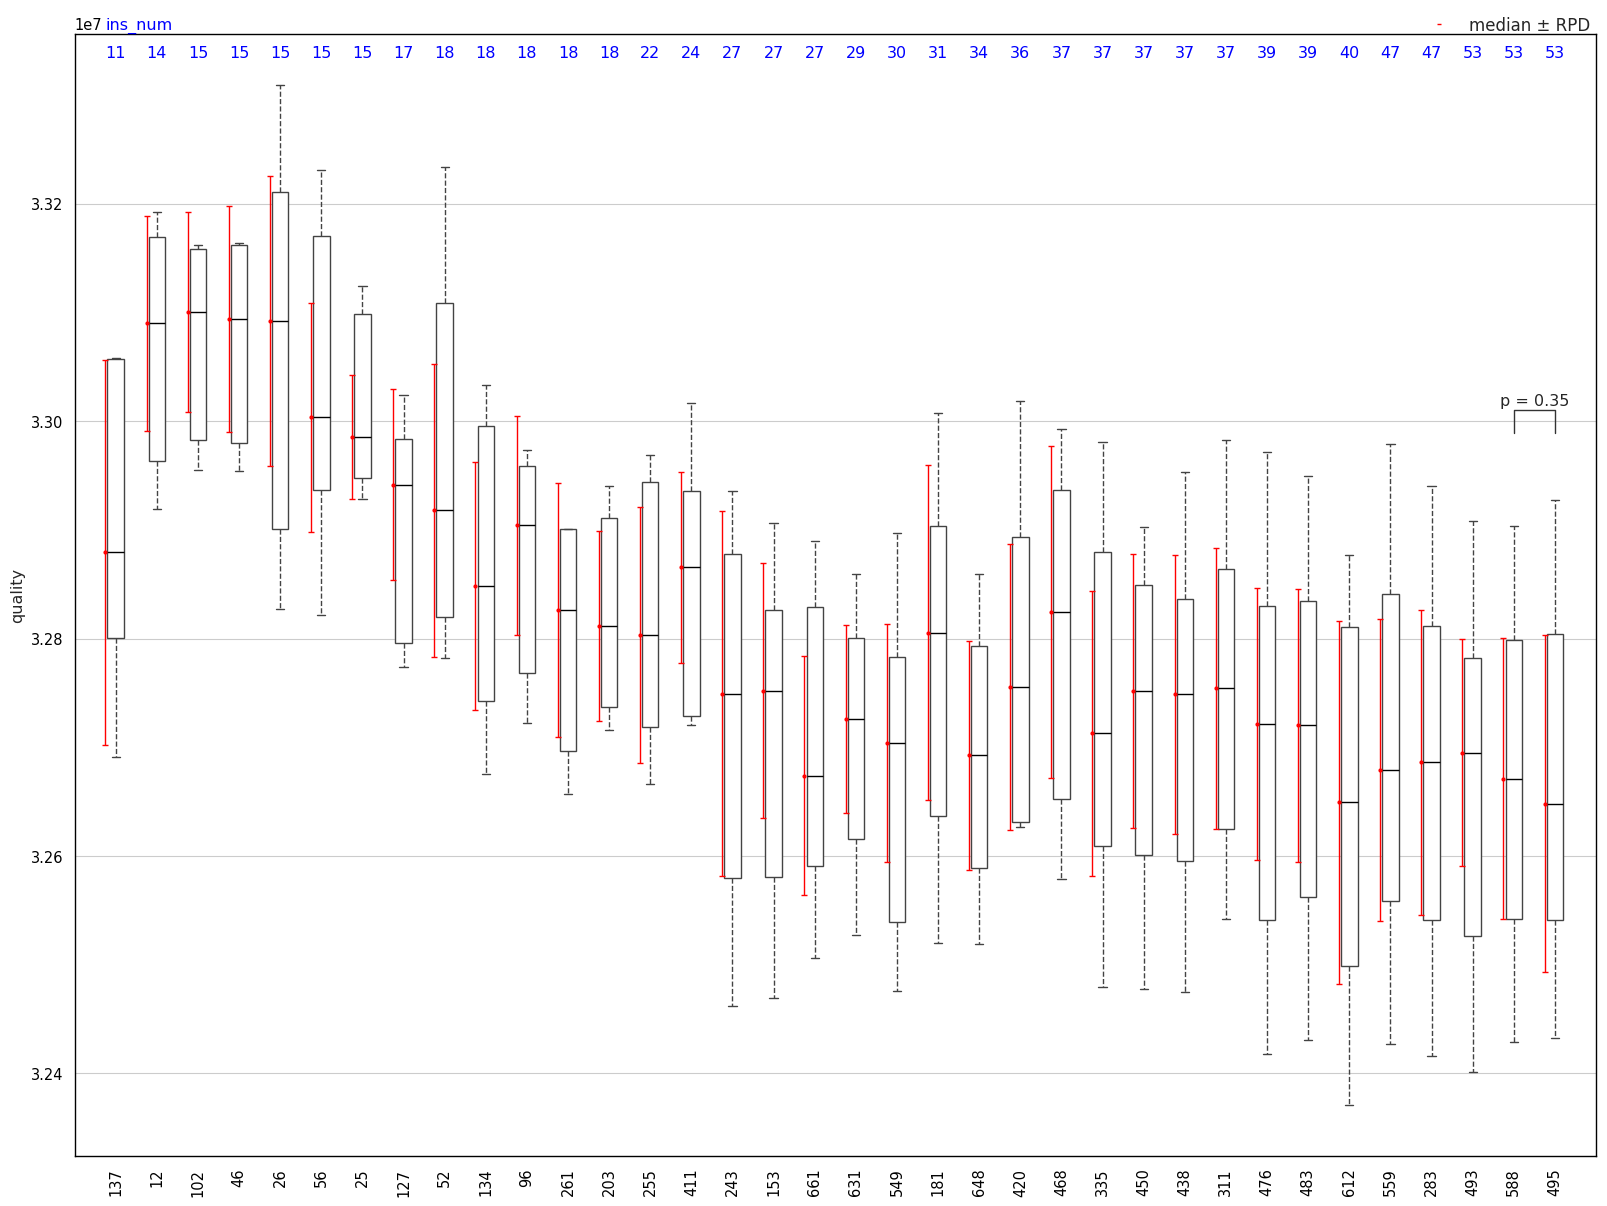
In this example, data is from ACOTSP and this plot is drawn on the training process for all elite configurations selected in this phase. Blue numbers on the top are numbers of used instance of each configuration, while black numbers on the bottom are configuration ids.